Thanks for your feedback!
EDIT
The Top Operations screen displays up-to-date information about the availability of the 15 most requested operations across all your APIs.
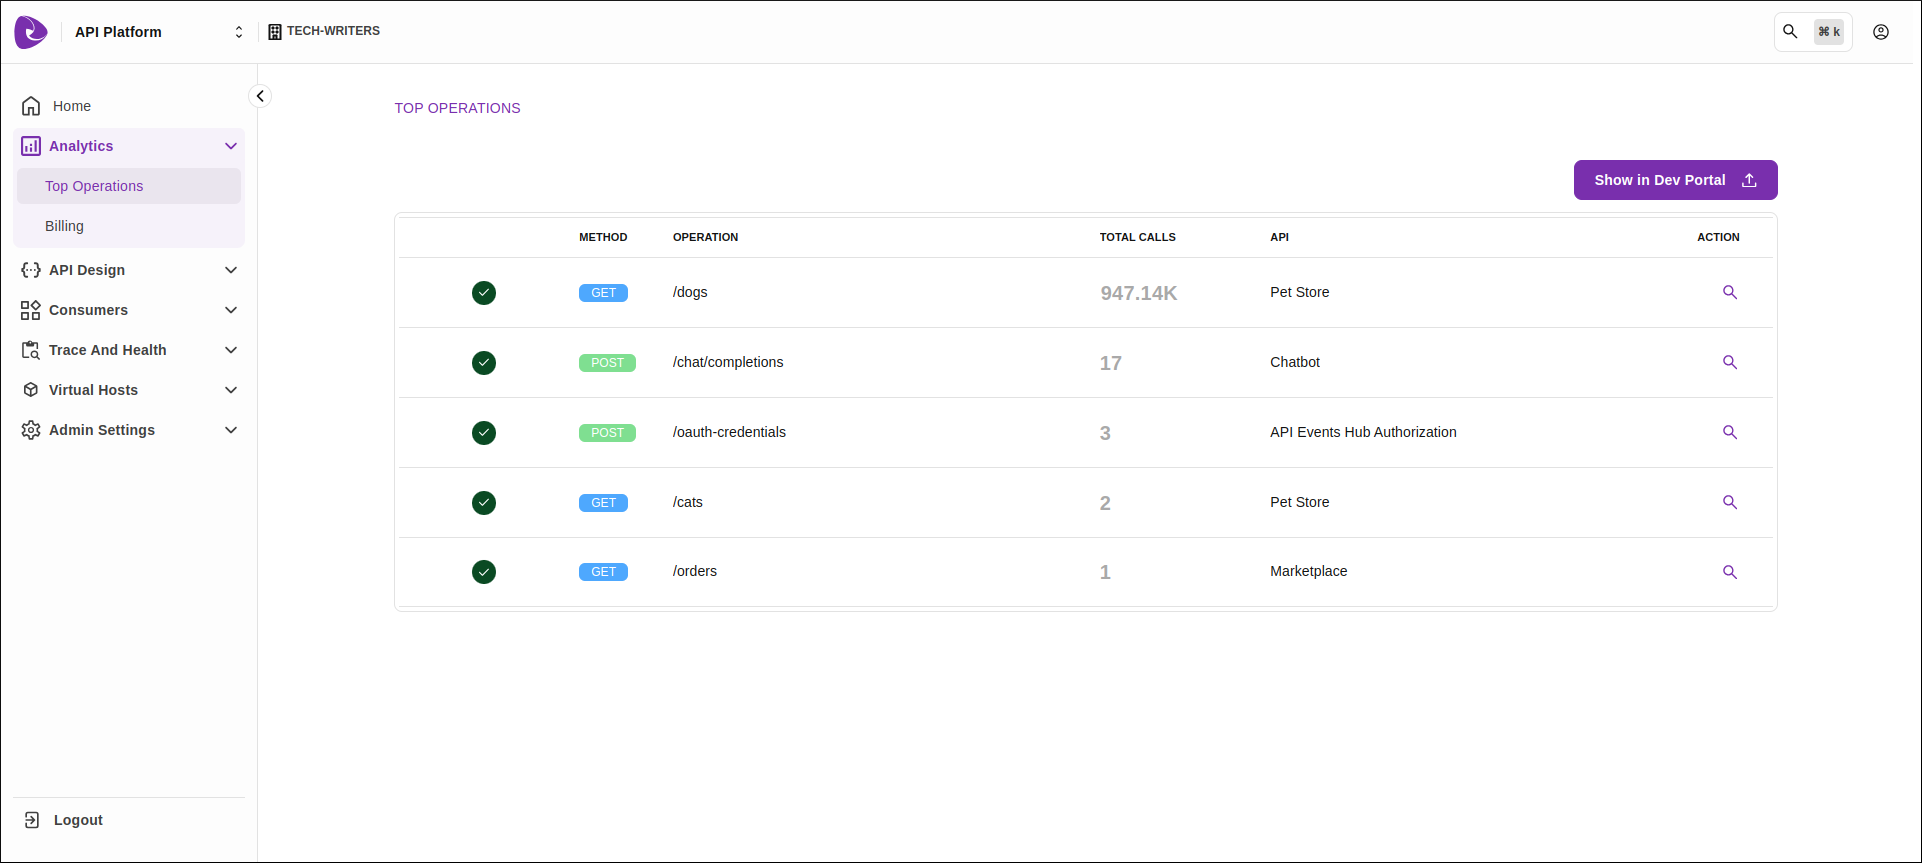
Availability is a metric defined by the percentage of successful requests based on the HTTP status codes returned (including client errors of the 4xx family). 5xx status codes, which represent server errors, are considered failures.
To identify the 15 most requested operations, we count the calls without distinguishing between different environments. The data is retrieved from the Metrics index and, by default, covers the last three months.
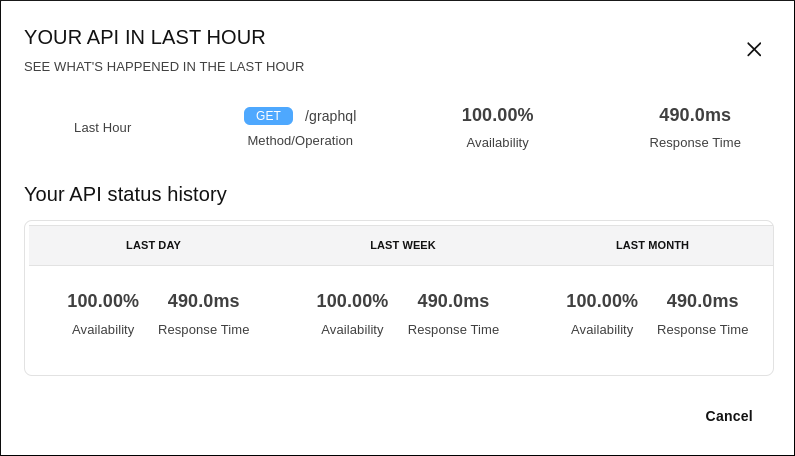
For each item in the list, you can see the average availability and response time by clicking the icon  .
We show this data for the last hour, last day, last week, and last month:
.
We show this data for the last hour, last day, last week, and last month:
In the Top Operations screen you can configure the resources that will be displayed in the API Status section of the Developer Portal. To do this, click SHOW IN DEV PORTAL, which displays checkboxes for the items in the list. After selecting the operations to display, click SEND TO DEV PORTAL.
You can then edit the list of operations displayed on the Portal by repeating the same process.
Share your suggestions with us!
Click here and then [+ Submit idea]